

That clean graph with your 5 conversions? It’s incomplete. We have done the checking, and the actual number of conversions could be way higher, but the Overview Dashboard isn’t designed to show you everything.
Let’s talk about the Google Ads Overview Dashboard, conversion discrepancies, and how BaseCloud stumbled across something Google doesn’t exactly highlight.
The Google Ads Dashboard vs Actual Conversions Problem
Marketers are relying on the Overview Dashboard in Google Ads to make budget and strategy decisions, and, according to our research, that is a big mistake.
Turns out, that summary is filtered in ways Google isn’t transparent about.
What Happened
We ran campaigns for a client, tracked leads on the website, confirmed them with Google Tag Manager, and saw the numbers stack up in both GA4 and our CRM.
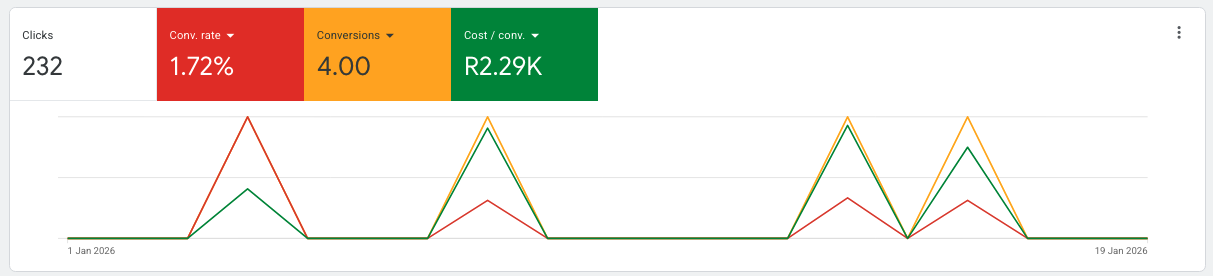
Above, you can see that this client received 4 leads for January to date, and the other stats are very poor.

But when we checked the Conversion Summary Table, the actual leads were 26.
The cost per lead, based on actual data, was $5.36, with a conversion rate of 11.21%. But if we had relied solely on the Google Ads Dashboard, we’d have assumed the campaign failed.
How Is That Possible?
We asked the same question and reached out to Google support.
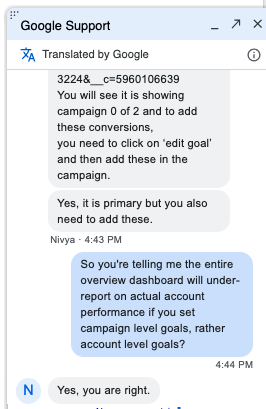
They explained that when you set a campaign to optimise for a specific goal (like form submissions), the Overview Dashboard only displays data for that goal. Other conversions (phone calls or emails) still happen and are still tracked, but they won’t appear in the Overview Dashboard. You need to check the Conversion Summary Table to see everything.
The Overview Dashboard Is Filtered by Default
The Overview Dashboard is filtered by default to show only select conversion actions. If you haven’t included all relevant actions, you’re missing crucial data.
Why Are Google Ads Conversions Different From Analytics?
Because each system tracks things differently. The Overview Dashboard doesn’t include all actions unless specified. Google Analytics, on the other hand, tracks all events without default filters.
To see all your conversions, you need to dig deeper.
The Conversion Summary Table: Your Best Data Source
Inside your Google Ads account is a table that shows all the details you need: the Conversion Summary Table.
How to Access It:
- Open your Google Ads account
- Click the wrench icon (Tools and Settings)
- Under “Measurement,” select “Conversions”
- Open the Conversion Summary Table
This table lists every tracked conversion action, whether it’s counted, its attribution model, and whether it’s included in optimization. If a conversion isn’t marked as ‘Primary,’ it won’t appear in the Overview Dashboard—but it still happens.
How Google Filters Conversion Data
Here’s how the Overview Dashboard filtering works:
- Displays only Primary Conversion Actions tied to your campaign goal
- Secondary Actions are tracked but shown separately in the Conversion Summary Table
- Attribution models affect how credit is assigned across touchpoints
Think of it this way: the Overview Dashboard shows you how well you’re doing against your stated goal. The Conversion Summary Table shows you everything that happened.
Enhanced Conversions Add More Complexity
If you use Enhanced Conversions, only those tracked within a certain attribution window may show up. Miss that window, and those conversions don’t appear at all.
This impacts:
- Smart Bidding
- Attribution models
- ROAS calculations
Checklist: See the Real Conversion Picture
Avoid making key decisions on incomplete data. Follow these steps:
Step 1: Check Your Conversion Summary Table
Go to Tools > Conversions > Summary Table. Verify all important actions are listed and included in reports.
Step 2: Compare With Google Analytics
Open GA4 and go to Reports > Life Cycle > Traffic Acquisition. Check how many conversions are tracked there versus Google Ads.
Step 3: Audit Tags in Google Tag Manager
Make sure all events are triggering correctly in GTM. Use Preview Mode or Tag Assistant for verification.
Step 4: Schedule PDF Reports
Export your conversion and traffic reports weekly to avoid sudden changes in how data is displayed or counted.
Why Are Conversion Numbers Different Across Platforms?
Each platform tracks and filters conversions differently. Here’s a breakdown:
| Source | What it Measures | Things Filtered |
|---|---|---|
| Google Ads (Overview Dashboard) | Only Primary conversion actions | Attribution model, conversion settings |
| Google Ads (Conversion Summary Table) | All actions you’ve configured, detailed breakdown | None (if viewed properly) |
| Google Analytics | All tracked events, not just Ads-driven | Might double-count or miss based on session logic |
Google Analytics focuses on user behavior across sessions. Google Ads counts events tied to ad clicks, which could include multiple clicks by the same user.
Attribution Models Affect Conversion Counts
Different attribution methods change how credit is assigned:
- Last click: Retargeting may get no credit
- Position-based: First and last get 40%, middle touchpoints get 20%
- Data-driven: Often lacks transparency
If you’re using different models across actions, the Overview data may not make sense at first glance.
How This Could Be Costing You Money
Marketers make decisions based on conversion data. If that data is missing or filtered, good campaigns might be paused or budgets misallocated.
For Smart Bidding strategies, bad data equals bad optimization. The system can’t perform well if the input is flawed.
Where to Find the Complete Picture
The Overview Dashboard isn’t wrong; it’s just filtered. For full visibility, use these:
- Conversion Summary Table – Shows all tracked conversions, not just those tied to campaign goals
- Google Analytics (GA4) – Tracks all events regardless of ad settings
- Scheduled PDF reports – Creates a consistent record you can reference
- Google Tag Manager audits – Ensures all events are firing correctly
A Note From BaseCloud
We discovered this issue while comparing conversions and CRM data. By diving into the discrepancies, reaching out to Google, and investigating thoroughly, we found how misleading the Overview Dashboard can be. One would think it’s a filter issue, but it’s actually a visibility issue.
Don’t Rely Only on the Overview Dashboard
As marketers, we deal with enough complexities as it stands. Misleading dashboards shouldn’t add to that. Now that you know the issue, you can find better data and make better decisions. Double-check your conversion setup today. Need help reviewing yours?
Reach out to BaseCloud. We specialize in making sense of numbers that don’t add up.


